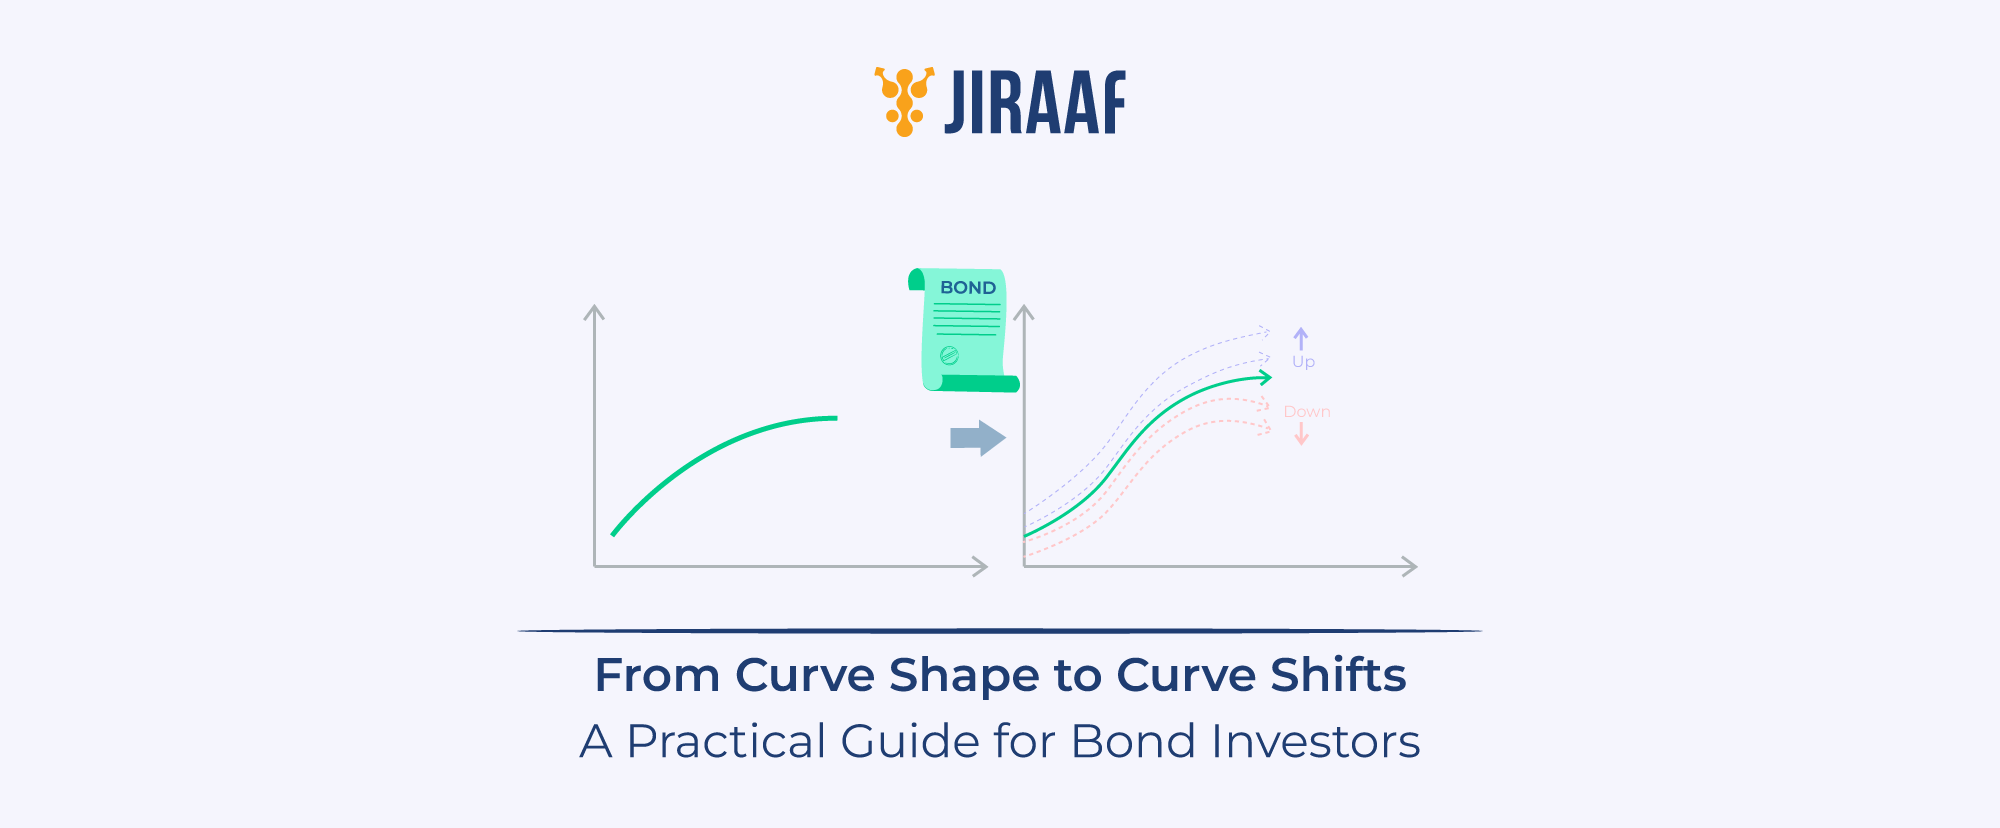
Yield curve shifts show how markets adjust expectations around interest rates, inflation, and growth across different maturities. This guide explains how to read these shifts and interpret what they signal for bond investors.
Debt markets often adjust to changing economic conditions even before those changes become visible in the broader economy. Bond yields begin to move long before policy changes are announced or growth data reflects a shift, capturing how investors price risk, inflation, and future interest rates. The movement in bond yields follows a structure that can be observed through yield analysis and its shifts over time.
Understanding these shifts allows you to read market expectations in real time. In this blog, we break down how yield curves work, how they change, and what these movements indicate for the economy and fixed income investors.
What is a Bond Yield Curve?
A bond yield curve is a graphical representation that plots the yield of bonds with similar credit ratings across varying maturity periods. On the curve, the Y-axis represents the yield (%), and the X-axis represents the time to maturity.

Source – Jiraaf
It serves as a key indicator of how market experts, analysts, and investors interpret the underlying risk in the market and where the nation’s economy may be headed by reflecting the returns investors demand for lending capital across different time horizons.
In the Indian context, this typically involves tracking yields across benchmark government securities such as the 2-year, 5-year, 10-year, and 30-year bonds. The relative positioning of these yields provides insight into how the market is pricing future rate movements and economic conditions.
What is Yield Curve Analysis?
Yield curve analysis involves interpreting the shape and slope of the yield curve to assess how markets are pricing future interest rates, inflation, and economic activity. By observing how yields vary across maturities, you can infer shifts in monetary policy expectations and broader macroeconomic conditions.
1. Normal Yield Curve
A normal or upward-sloping yield curve reflects a well-functioning, expansionary economic environment, where long-term yields are higher than short-term yields.

Source – Jiraaf
This structure exists because investors demand a term premium for locking capital over longer durations, compensating for inflation uncertainty and interest rate risk.
From a behavioural standpoint, this shape is sustained when:
- Short-term rates are anchored by current policy levels
- Long-term investors demand higher yields to account for future uncertainty
- There is no immediate expectation of aggressive rate cuts
In such phases, capital allocation remains balanced across the curve, with no disproportionate demand for either end.
2. Steep Yield Curve
A steep yield curve represents an accentuated version of the normal curve, where the spread between short-term and long-term yields widens significantly. It is often observed during the early phases of an economic cycle or post-policy easing, where markets begin to price in stronger growth ahead.

Source – Jiraaf
The steepening is driven by a divergence in investor behaviour:
- Short-term yields remain relatively low, often due to accommodative monetary policy or excess liquidity
- Long-term investors demand higher yields in anticipation of future rate hikes, inflation pressures, and increased borrowing requirements
This leads to a sell-off in long-duration bonds, pushing their yields higher relative to the short end.
3. Inverted Yield Curve
An inverted yield curve emerges when short-term yields exceed long-term yields, and is widely regarded as a forward-looking signal of economic slowdown or recessionary expectations. While common in developed markets like the US, a sustained inversion is rare in the Indian sovereign bond market due to different structural liquidity dynamics.

Source – Jiraaf
This inversion is driven by a combination of policy tightening and investor positioning:
- Central banks raise short-term rates to control inflation, pushing up yields at the front end
- Simultaneously, investors anticipate a slowdown and eventual rate cuts, leading them to increase exposure to long-duration bonds
- This demand pushes up long-term bond prices and compresses their yields
It results in a structural inversion, where the long end of the curve reflects expectations of lower future rates, even as current policy remains restrictive.
4. Flat Yield Curve
A flat yield curve occurs when yields across maturities converge within a narrow range, indicating a transition phase in the economic cycle. It often precedes either a steepening or inversion, making it a critical inflection point in yield curve analysis.

Source – Jiraaf
For instance, a 2-year bond yielding 6%, a 5-year at 6.1%, and a 10-year at 6% reflects a market that lacks a clear directional view on future rates.
This typically arises when:
- Markets are uncertain about the trajectory of monetary policy
- There is ambiguity around growth and inflation outlook
- Investors are unwilling to take strong duration bets
From a flow perspective, capital is distributed more evenly across maturities, as neither short-term instruments nor long-duration bonds offer a clear relative advantage.
While the yield curve analysis shows how yields are structured across maturities at a given time, reflecting current market expectations, a yield curve shift captures how those yields move over time as expectations around interest rates, inflation, and growth change.
However, markets do not remain static, and the curve itself evolves as expectations change over time.
What is a Yield Curve Shift?
A yield curve shift refers to the change in yields across different maturities over a period of time, reflecting a repricing of interest rate expectations, inflation outlook, and liquidity conditions.
Unlike the yield curve itself, which is a static representation, a shift captures the dynamic movement of the curve, whether yields are rising, falling, or changing unevenly across tenors.
These shifts are driven by:
- Changes in central bank policy stance
- Inflation surprises or growth data
- Global capital flows and risk sentiment
These movements are not random and tend to follow identifiable patterns based on how different parts of the curve react.
Types of Yield Curve Shifts in Bond Markets
1. Parallel Shift
A parallel shift occurs when yields across all maturities move in the same direction by a similar magnitude. The curve retains its shape, but the overall level resets.

Source – Jiraaf
- Upward shift: Yields rise across the curve as bond prices fall, usually when markets reprice interest rates higher due to inflation surprises or a more hawkish central bank stance.
- Downward shift: Yields decline across maturities as bond prices increase, typically driven by expectations of rate cuts, softer inflation outlook, or a shift towards safer assets like FDs.
This happens as the market is reprices the base level of interest rates, not making a relative call across maturities.
2. Steepening Shift
A steepening shift reflects a widening gap between long-term and short-term yields.

Source – Jiraaf
- Bullish Steepening: If short-term yields fall faster than the long-term yields, it indicates expectations of near-term rate cuts while long-term inflation or growth expectations remain intact.
- Bearish Steepening: If long-term yields rise faster than the short-term yields, it usually signals concerns around inflation, fiscal borrowing, or term premium expansion. Investors demand higher compensation for locking money long-term.
In both cases, the common thread is divergence in expectations between the near term and the long term.
3. Flattening Shift
A flattening shift occurs when the difference between short-term and long-term yields compresses.

Source – Jiraaf
- Bull Flattener: If long-term yields fall faster than short-term yields, it reflects a flight to safety or expectations of slower growth, pulling long yields down.
- Bear Flattener: If short-term yields rise faster than long-term yields, it usually happens when the central bank hikes rates aggressively to curb inflation, while the long end remains anchored by expectations of an eventual economic slowdown.
Flattening often signals that markets expect current policy tightening to eventually slow the economy, reducing long-term rate expectations.
4. Curvature Shift
A curvature or butterfly shift captures changes in the middle of the curve relative to the short and long ends.

Source – Jiraaf
- Positive butterfly: The curve becomes less “humped.” This happens when the wings (short and long ends) rise more than the belly (middle maturities), or the belly falls more than the wings.
- Negative butterfly: The curve becomes more “humped.” This occurs when the middle of the curve (e.g., 5-year to 10-year) rises more than the short and long ends.
This is less about macro direction and more about relative value and positioning within the curve, often driven by institutional flows rather than broad economic signals.
While these shift patterns help frame how yield curves move in theory, their real significance becomes clearer when you observe how they have played out in the Indian bond market.
Bond Yield Curve Shifts in India: Key Trends
These patterns are not just theoretical and can be observed clearly in how the Indian bond market has evolved over time.
- Year 2020: Bull Parallel Shift

Source – researchgate.net
In 2020, the yield curve moved lower across almost all maturities, reflecting a broad-based repricing of interest rates. This was not driven by relative positioning within the curve, but by a systemic shock. As the pandemic disrupted economic activity, the RBI responded with aggressive rate cuts and large-scale liquidity injections.
Short-term yields reacted first, as they are directly linked to policy rates. However, excess liquidity in the system and a weak growth outlook led to a decline in long-term yields. Investors were not demanding higher returns for holding longer-duration bonds because the immediate priority shifted to capital preservation and stability.
The result was a parallel downward shift, where the entire curve adjusted lower, signalling a sharp reset in interest rate expectations across the economy.
- Year 2022: Bear Flattening

Source –quantumamc.com
It started in 2022, when the macro environment had changed significantly. Inflationary pressures, both global and domestic, forced the RBI to reverse its accommodative stance and begin tightening monetary policy. This shift was reflected most clearly at the short end of the curve.
Short-term yields rose sharply as markets quickly priced in successive rate hikes. Instruments with maturities of 1 to 3 years moved almost in tandem with policy expectations. However, long-term yields did not rise at the same pace. This is because markets simultaneously began factoring in the possibility that aggressive tightening could slow down growth in the future.
As a result, the gap between short-term and long-term yields narrowed. The curve flattened; not because long-term yields fell, but because they rose more gradually compared to the front end.
3. 2023 to 2026: Episodic Steepening Amid Range-bound Yields

Source –Tradingeconomics
From 2023 onwards, India’s yield curve stopped reacting purely to RBI policy and began reflecting a broader set of drivers.
In 2024, yields declined meaningfully as demand improved, supported by fiscal discipline and global index inclusion expectations. The 10-year yield saw one of its sharpest annual declines in recent years, indicating strong demand for duration.
However, this trend reversed intermittently through 2025 and into 2026. Despite policy stability and even liquidity support from the RBI, yields remained under pressure due to elevated government borrowing and weaker demand from institutional investors.
By early 2026, the 10-year yield moved back towards the 6.7% to 6.9% range, with periodic spikes driven by global factors such as crude oil prices and U.S. yields.
Conclusion
Yield curve analysis and its shifts offer a structured way to understand how financial markets respond to changing macro conditions. They help investors identify whether policy, inflation expectations, or broader capital flows drive the change. Bond yield movements are key metrics that analysts use to distinguish between temporary volatility and meaningful shifts in market direction.
Once investors start viewing bond yields this way, it becomes easier to understand where the broader market is headed next.