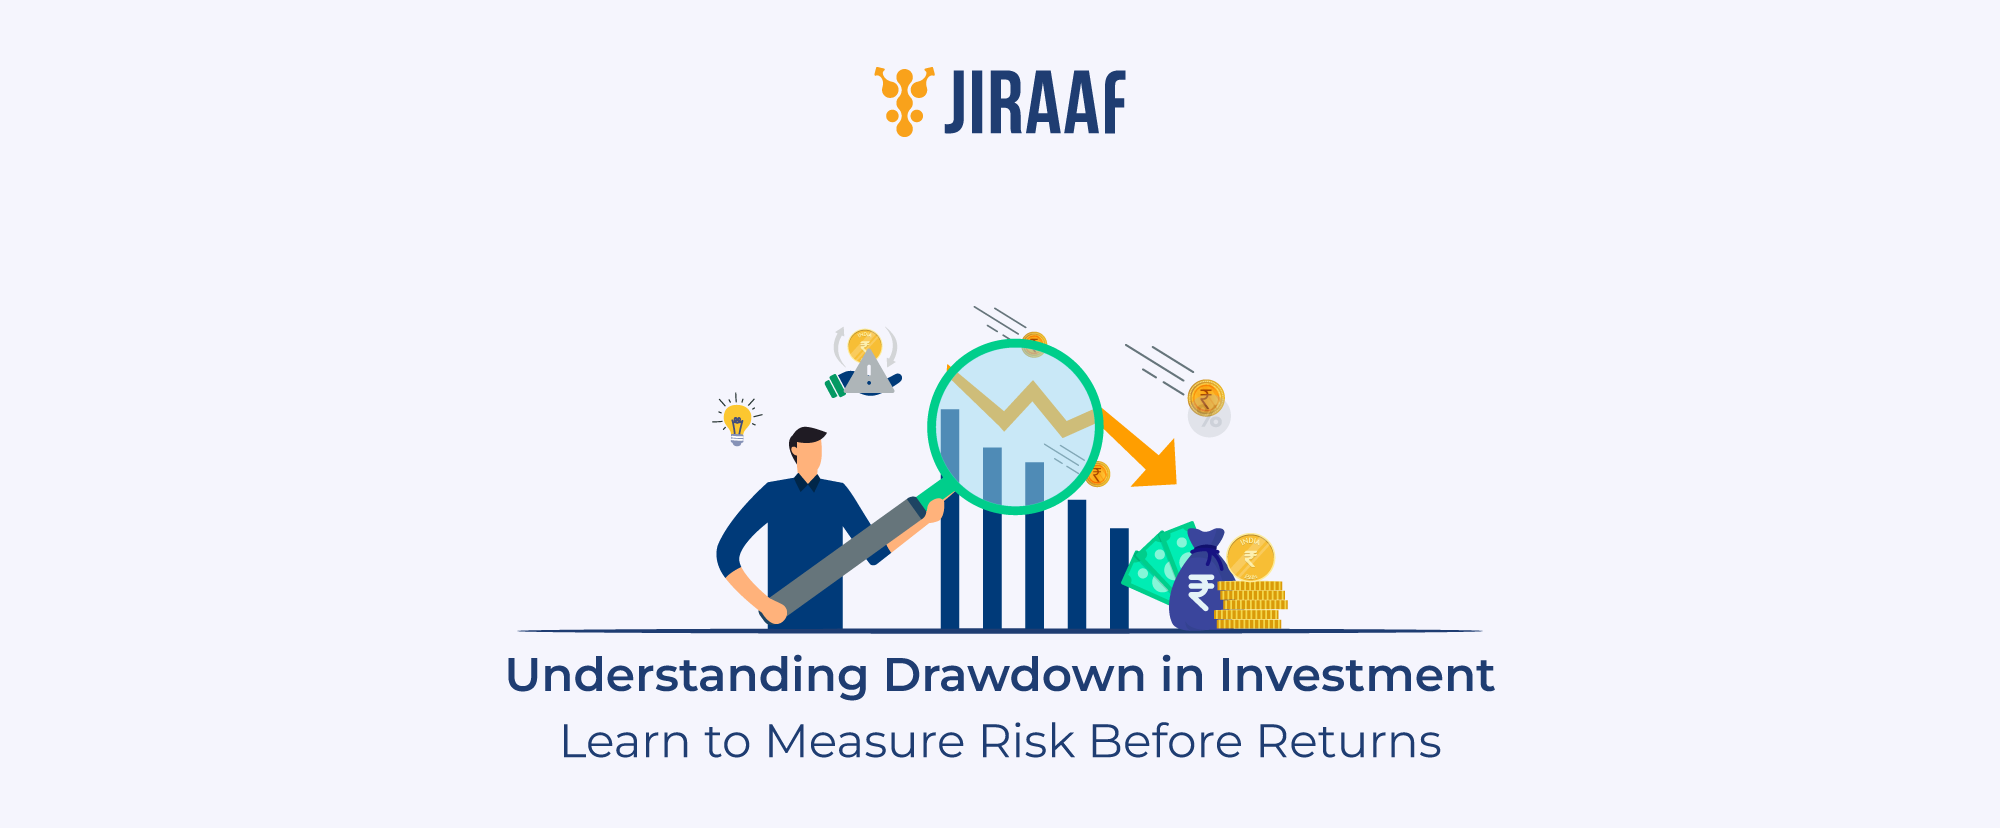
Before chasing returns, understand how much your portfolio can fall and how drawdown shapes your investment outcomes.
Most investors focus only on how much their portfolio can grow, often overlooking how much it can fall.
And that gap in thinking can turn costly as a 30% decline in your portfolio doesn’t need a 30% gain to break even; it requires 42.86%. And as losses deepen, the recovery required grows disproportionately harder.
This process is not just considering a worst-case scenario, but a way of measuring the risk of potential loss, also known as drawdown.
In this blog, we break down what drawdown means, how to measure it, and the strategies that can help you manage the drawdown risk in your portfolio.
What is Drawdown in Investing?
A drawdown is a metric that measures how much an investment, fund, or portfolio can fall from its peak to its trough (highest point of value to lowest point) over a period of time, expressed as a percentage. Backtesting the drawdown of an investment instrument gives you a clear sense of how deep a fall your portfolio can take and how long it may take to bounce back.
It offers a crucial way to assess risk when considering investing in a particular asset, fund, or building an entire portfolio. Experts use this metric to compare investments, evaluate past performance, understand how much loss potential a fund or portfolio has historically endured, and, more importantly, how long the recovery has taken.
At its core, drawdown is defined by two factors: money and time.
- The money factor captures how far the value of an investment, fund, or a portfolio has fallen historically
- The time factor shows how long it takes the investment, fund, or portfolio to recover and reach a new peak
Together, these two factors give you the full picture of a loss, its depth, and its true cost in time.
Understanding Maximum Drawdown
Maximum Drawdown (MDD) is the largest decline an investment experiences from its peak to its lowest point over a specific period. In simple terms, it tells you how bad things got at their worst before the investment started recovering.
MDD is widely used for backtesting investment strategies and for portfolio analysis. It is a go-to metric for fund managers and analysts when stress-testing a portfolio’s performance under adverse market conditions.
Here is what makes it a critical metric:
- It captures the worst-case scenario of an investment, fund, or a portfolio
- It sets a benchmark for potential loss
- It allows direct comparison of risk levels across different funds or strategies
For you as an investor, MDD helps set realistic expectations, compare different investments, and decide whether a particular level of risk fits your comfort and long-term goals.
How Drawdowns Affect Portfolio Recovery
A drawdown doesn’t just reduce your portfolio value; it also makes its recovery harder. So, the deeper your portfolio falls, the higher the return required to reach breakeven.
Here is a simple visual to help you understand how much your portfolio needs to gain just to break even after a certain percentage decline.

For example, if your portfolio falls by 10%, it needs to gain 11.1% to break even, not 10%. The difference may seem small, but it widens quickly as losses deepen.
So, if you invest ₹50,000 and your portfolio falls by 50%, it drops to ₹25,000. To break even, your ₹25,000 portfolio will now need to double in value, or gain 100%. At a 75% drawdown, the recovery required rises sharply to 300%.
How Analyzing Drawdown Risk Helps Investors
Drawdown is a practical metric that helps you make better investment decisions by considering the potential loss limit of an underlying investment, fund, or portfolio.
- Helps define risk limits and position size
By understanding how much an investment can fall, you can decide how much capital to allocate and where to set exit levels. This prevents a single position from damaging your overall portfolio.
- Enables better investment comparison
Drawdown gives you a clearer picture of risk than returns alone. Two investments may deliver similar returns, but the one with lower drawdowns is often easier to hold through market cycles.
- Improves diversification decisions
Analyzing drawdowns across assets and helps you identify how different investments behave during market stress.
- Builds psychological readiness
Knowing the potential depth of losses prepares you mentally. When drawdowns occur, you are less likely to panic because you already expected that level of decline.
- Estimates recovery timelines
Drawdown analysis shows not just how much an investment falls, but how long it takes to recover. This helps you align your investments with your time horizon and financial goals.
Strategies to Manage Drawdown Risk in Your Portfolio
Drawdowns are a natural part of investing. The goal is not to avoid them completely, but to limit how deep they go and how long they last.
- Diversify across assets and strategies
Spreading investments across asset classes and sectors reduces the impact of a sharp fall in any one area, helping stabilize overall portfolio performance.
- Control position sizing
Avoid over-allocating to a single investment. Keeping position sizes in check ensures that one wrong call does not significantly damage your portfolio.
- Use predefined exit rules
Setting clear exit levels or stop-loss thresholds helps you limit losses before they deepen, removing emotional decision-making during market stress.
- Rebalance periodically
Regularly reviewing and adjusting your portfolio helps lock in gains and prevents overexposure to assets that have already run up, reducing future drawdown risk.
Investing strategically helps you manage drawdown and build a portfolio that can withstand market declines over time.
Final Thoughts: Role of Drawdown in Portfolio Management
A drawdown reflects how your investments have performed during past market declines. It gives you a realistic view of the potential loss limit, helping you set expectations before you invest. When you understand the maximum vulnerability of an investment instrument, your decisions become more measured and less reactive. Over time, this clarity helps you stay aligned with your goals and navigate market cycles with confidence.