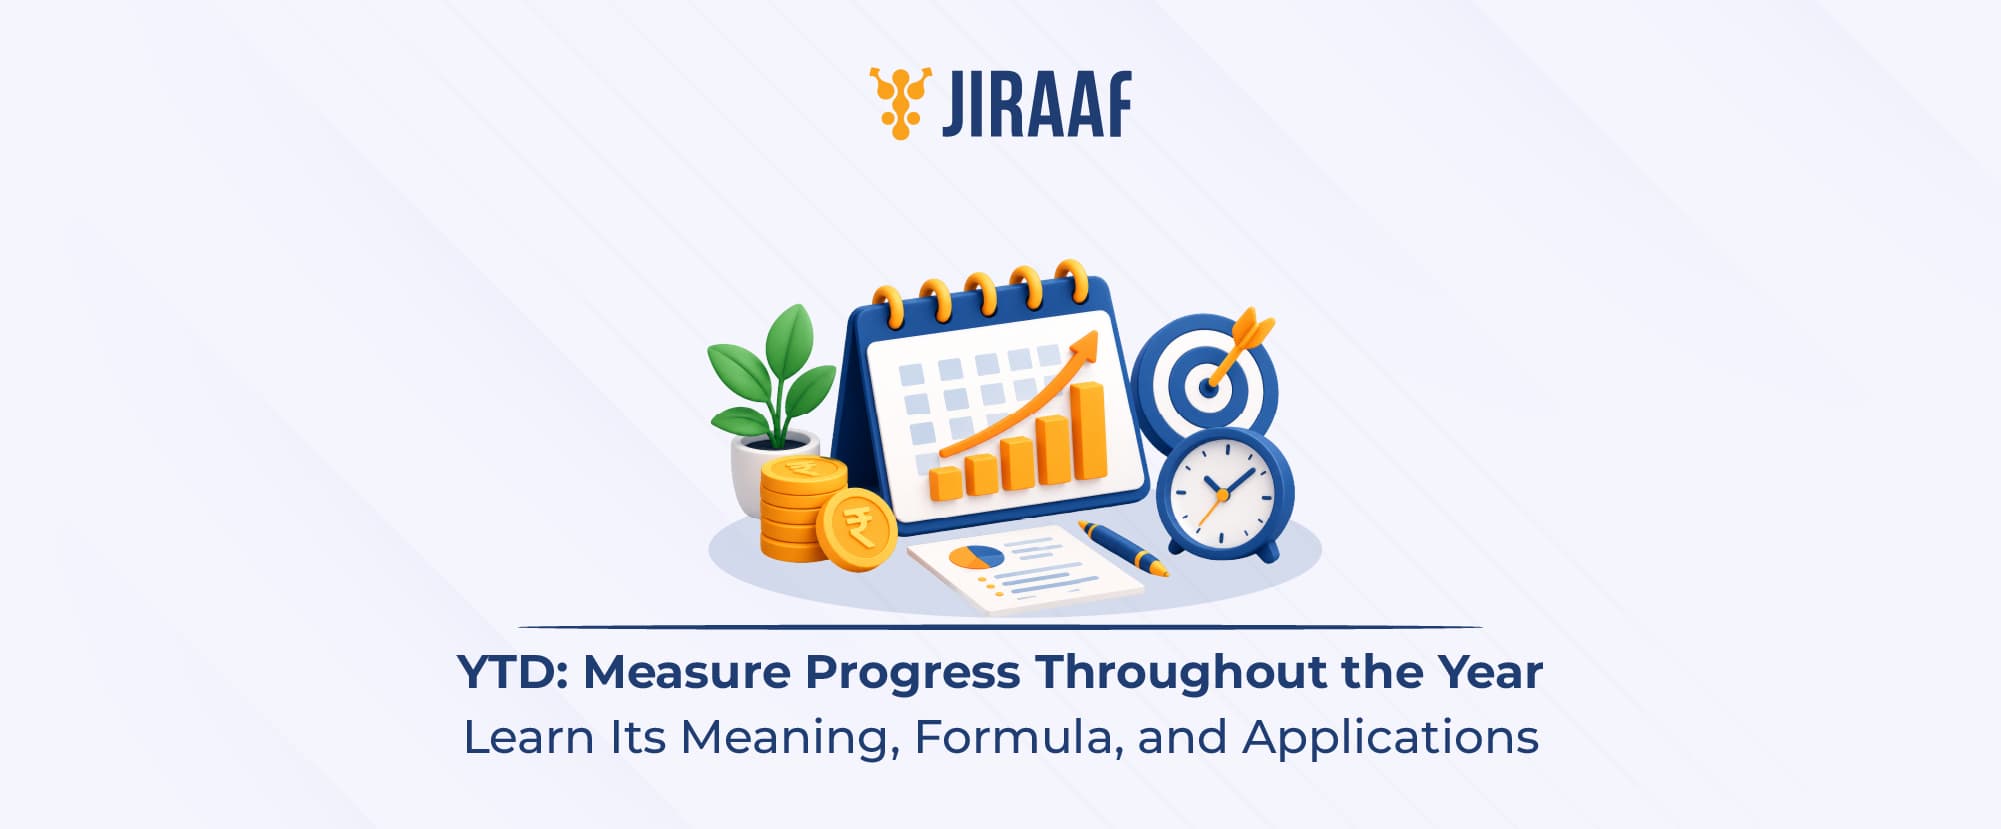
YTD is a financial metric used to assess progress against annual targets, compare investment performance, and review cumulative figures across different fields.
Quick Overview:
- YTD measures changes from the start of the relevant year to the current date. Investment returns usually use 1 January, while salary, banking and business figures in India usually follow the financial year starting 1 April.
- In mutual funds, YTD helps investors compare scheme returns with category peers and benchmarks over the same period.
- YTD mutual fund returns can be calculated using the change in NAV from 1 January.
- YTD is an absolute return measured from the start of the year, so unlike CAGR it isn’t annualized.
Whether investors review mutual fund returns, businesses assess quarterly sales targets, or salaried professionals check tax deductions, measuring financial progress requires a defined timeframe. Year-to-Date (YTD) provides this reference by measuring cumulative performance from the start of the year being measured: 1 January for calendar-year figures, or 1 April for financial-year figures in India
Read on to understand how YTD works, how to calculate it, and how it helps evaluate mutual fund performance across different periods.
What Is YTD Full Form and Meaning?
YTD stands for Year-to-Date. It refers to the period from the beginning of the calendar year (1 January) to the current date. It helps measure the cumulative change in an asset’s value, business performance, income, expenses, and other financial indicators over this period.
For example, if gold were priced at ₹1,00,000 per 10 grams on 1 January and rose to ₹1,10,000 by 16 October, its YTD price increase would be 10%.
YTD is also used in accounting, sales, project management, and marketing to track progress against targets or compare performance over a defined period.
What Is YTD in Mutual Funds?
In mutual funds, YTD measures a scheme’s performance from the start of the calendar year to the most recent available date. Investors use it to review returns, compare schemes within the same category, and assess performance against a benchmark.
For instance, if a mutual fund has delivered an 8% YTD return while its benchmark has gained 6% over the same period, the fund has outperformed its benchmark by 2 percentage points. However, this comparison alone does not establish whether the fund is a suitable investment. Its longer-term performance, risk, and consistency also matter.
How to Calculate YTD Returns in Mutual Funds?
Investors can calculate the YTD return of a mutual fund using the following formula:
YTD Return (%) = [(Current NAV − NAV on 1 January) / NAV on 1 January] × 100
Example:
Suppose a mutual fund had a NAV of ₹100 on 1 January, and its NAV increased to ₹108 by 16 October. The YTD return would be:
YTD Return = [(₹108 − ₹100) / ₹100] × 100
= (₹8 / ₹100) × 100
= 8%
Therefore, the fund’s YTD return as of 16 October is 8%, based on the change in NAV. This calculation does not account for distributions or other cash flows. Investors should use a consistent return methodology when comparing schemes.
YTD in Different Contexts
YTD is not limited to investment performance. Businesses, banks, and employees also use it to track cumulative financial activity and understand how figures have been added over the year.
YTD in Banking
Banks use YTD figures to track cumulative financial activity, such as interest earned, fees charged, deposits, and withdrawals. These figures help account holders and financial institutions review activity over a defined period.
For example, a savings account statement may show ₹4,000 in interest earned by YTD. This represents the total interest recorded from the start of the applicable reporting period to the statement date.
YTD in Sales
In sales, YTD represents the total sales generated from the beginning of the year to the current date. Businesses use it to monitor revenue, compare performance with previous periods, and measure progress towards annual targets.
For example, if a company generates ₹25 lakh in sales during the first quarter and ₹35 lakh in the second quarter, its YTD sales at the end of June would be ₹60 lakh.
YTD in a Salary Slip
In a salary slip, YTD figures show the cumulative earnings and deductions recorded for an employee during the applicable reporting period. These may include gross salary, income tax deducted, Provident Fund (PF) contributions, and other payroll deductions.
For example, an employee earning ₹50,000 per month would have cumulative gross earnings of ₹3 lakh from January to June, assuming the same salary each month and no additional earnings. YTD figures help employees track total earnings and deductions without reviewing each month’s salary slip separately.
The exact period covered by banking statements and salary slips can depend on the reporting system. Employees and account holders should check the dates specified in their documents.
Difference Between YTD, CAGR & Absolute Return
| Basis of Comparison | YTD | Compound Annual Growth Rate (CAGR) | Absolute Return |
| Meaning | Measures an investment’s return from the start of the current calendar year to the latest date | Measures the annualized growth rate of an investment over a stated period, assuming returns compound at a steady rate | Measures the total percentage gain or loss on an investment over its holding period |
| Time period | From 1 January to the current date | Typically used for periods longer than one year, but can also be calculated for shorter periods | Any holding period, from a few days to several years |
| What it shows | Performance achieved so far in the current calendar year | The average annual pace of growth over the investment period | The overall percentage gain or loss from start to end |
| Compounding | Does not annualize returns | Incorporates compounding and expresses growth as an annualized rate | Does not annualize returns or explicitly account for compounding |
| Best used for | Reviewing how an investment has performed during the current year | Comparing the annualized growth of investments held for different periods | Understanding the total profit or loss over a specific holding period |
Conclusion
YTD is a rear-view mirror showcasing how much ground an asset or business has covered since the beginning of the year. However, it cannot predict what will happen next. Investors should look beyond the numbers and examine the reasons behind the performance. If an asset underperforms its benchmark, investors can assess whether the underlying investment outlook has changed or whether short-term market conditions explain the decline. Ultimately, treat YTD as a starting point for further analysis, not the sole basis for investment decisions.