The yield curve is one of the most closely watched indicators in finance and economics. While it might seem like a simple chart showing interest rates on government bonds, in reality, it tells a deeper story—one that reflects how investors view the future of the economy, inflation, and interest rates.
Unlike many financial indicators, the yield curve has a longstanding track record of predicting economic trends, particularly recessions. It captures market expectations and distils them into a single, intuitive image. By analyzing its slope, investors and policymakers can gain valuable insights into the direction the economy may be heading.
In this article, we’ll explore what the yield curve is, the different forms it can take, how it reflects economic conditions, and how you can use it to guide your investment decisions. Whether you’re a student of economics or a market participant, understanding the yield curve can give you a clearer view of what lies ahead.
What Is a Yield Curve?
A yield curve is a graphical representation of the relationship between yields (returns) of bonds of different maturities. It plots the cost of borrowing for various periods.
A yield curve plots the treasury yields across different time horizons, ranging from short-term G-secs such as T-bills to long-term papers like the 10-year, 20-year, and 30-year bonds.
Conventional understanding in economics is that investors demand a higher yield for long-term borrowings compared to that of shorter-term borrowings. This is because long-term borrowings mean more risk with reduced liquidity.
A normal yield curve is sloped upwards, factoring in the higher yield demand for longer terms.
Types of Yield Curves
Yield curve is an important economic indicator that has withstood the test of time in predicting the economic climate of the economy based on yield changes of government securities. The yield curve is a leading indicator that changes shape to reflect changes in the yield. Here are the different types of yield curves an economy can witness and the predictive power of the yield curve type.
Normal Yield Curve

A normal yield curve is an upward-sloping curve typically observed during periods of healthy economic growth. This yield curve represents the investor demand for higher yields on long-term government debt securities, signifying their confidence in the economy’s near-term economic growth prospects.
This curve reflects investor confidence in future economic growth, controlled inflation, and stable interest rates. A normal yield curve is the economic equivalent of things going well in the economy.
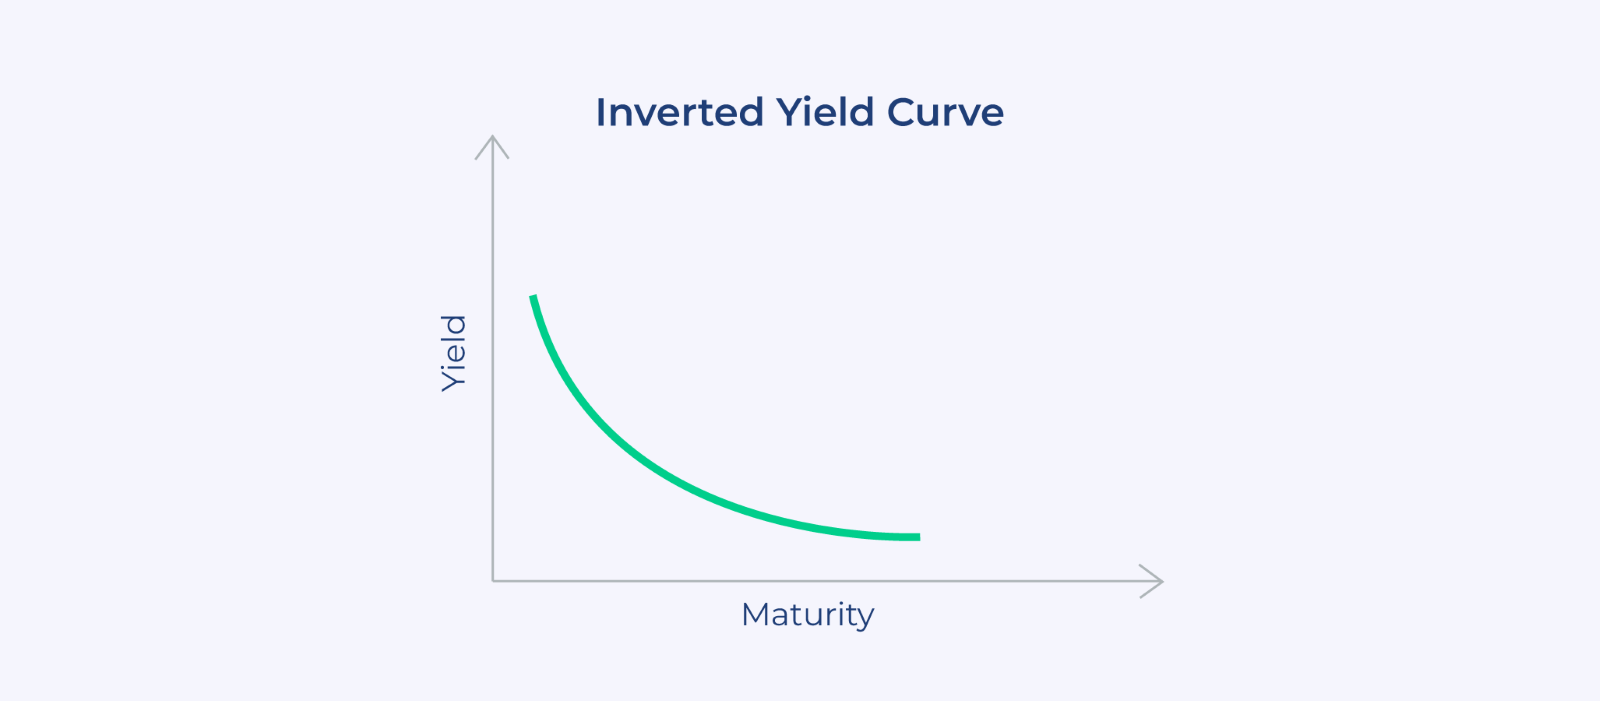
Inverted Yield Curve

An inverted yield curve is where things start getting a little scary and interesting. An inverted yield curve is a downward-sloping curve that results from yield flipping, where short-term yields are higher than long-term yields.
Yields flip when the investors place a higher risk premium on near-term economic growth compared to long-term prospects. This is when investors start shifting money to long-term government bonds, resulting in the inversion of the yield curve.
The yield curve inversion causes alarm as it is seen as a sign of recession or economic uncertainty. Historically, the inverted yield has successfully predicted the 1950, 1966, and 1998 US recessions. But this doesn’t mean that all inversion events will lead to a recession. Some yield curve inversions have been brief, not resulting in a recession.
Flat Yield Curve

A flat curve occurs when all maturities, whether short-term or long-term, have very similar yields. This means that the yield on a short-term bond, such as a 90-day bill, and a long-term bond, such as a 10-year or 30-year bond, have little to no difference, causing the yield curve to flatten.
A flat curve is usually seen during the transition from a normal yield curve to an inverted one (or vice versa), particularly when investors predict a policy or a major economic turning point. It primarily reflects shifts in monetary policy, market uncertainty, and investors’ inability to make decisions.
Humped Yield Curve
A humped yield curve, also known as a bell-shaped curve, develops when medium-term bond yields (e.g., 5-10 years) exceed both short-term and long-term rates.
A humped curve is not very common and typically occurs due to market anomalies, slowing economic growth, or rising inflation expectations. It suggests uncertainty in the market or inflation risks in the medium term.
Yield Curve as an Economic Indicator
The yield curve reflects the health of an economy. This makes the yield curve a crucial economic indicator. Here is how the yield curve has earned its reputation as a crystal ball for the economy.
What an Inverted Yield Curve Means for the Economy
An inverted yield curve signals challenging economic times ahead and a probable recession. Historically, every US recession in the past 50 years has preceded a yield curve inversion. This indicates a strong correlation between yield curve inversions and recessions.
An inverted yield curve indicates that investors are skeptical about near-term growth prospects, causing them to withdraw funds from short-term US government bonds and reallocate them to longer-term bonds. This makes the inverted yield curve a crucial behavioral indicator, as it offers insights into investor expectations and psychology.
The ominous signal of recession means every yield curve inversion event is treated with seriousness, and central banks take all possible actions to reverse the inversion via policy intervention to prevent a recession.
While the yield curve is a tested indicator, as an investor, it is essential to note that not all yield curve inversion events are followed by a recession. The yield curve has inverted over 70 times since 1977, but we have only seen a handful of recessions. As an investor, you should not look at a yield curve inversion event in isolation, but rather in conjunction with other factors such as the inflation rate, employment rate, and central bank action in response to the inversion, before making changes to your asset allocation.
Note: It is essential to understand the fact that the economic and signaling impact of an inverted yield curve is typically observed for government securities (G-secs) and not corporate fixed-income securities. Additionally, when media reports discuss yield curve inversions, it is most often the US Treasury yield curve that is being referenced.
Yield Curve and Interest Rates
The US Fed plays a pivotal role in shaping the short end of the yield curve through its interest rate policies. When the Fed raises rates to combat inflation, short-term yields go up. If long-term yields don’t follow suit—maybe because investors believe inflation will come down—then the curve flattens or inverts.
For instance, if the Fed raises the federal funds rate aggressively in response to high inflation, the yield on a 2-year Treasury note may spike. But if investors believe the rate hikes will eventually cause a recession, demand for the safety of long-term bonds increases, driving down the 10- or 30-year yields. This is how the curve becomes inverted.
Understanding how monetary policy and market expectations interact within the yield curve helps investors forecast not only potential changes in interest rates but also broader shifts in the business cycle. This understanding can help investors shape their investment decisions and build efficient portfolios for both the long and short term.
Risks Associated with the Yield Curve
While the yield curve can be incredibly insightful, it’s not without risks. It is not a foolproof indicator, meaning that not all yield curve inversions will lead to a recession. At times, the yield curve can invert for a brief period. As an investor, you may end up making unnecessary changes to your asset allocation in a race to prepare for a recession when, in reality, the recession might not happen at all. You can lose potential gains in such cases.
Another significant risk is timing. The yield curve may predict a recession, but it doesn’t tell you when. For example, the yield curve inverted in 2006 in the US, but it took nearly two years for the recession to begin officially. If you’d exited the market based solely on the inversion, you might’ve missed out on some solid gains.
And finally, don’t forget emotional risk. Seeing an inverted yield curve can trigger panic selling or overly conservative investment decisions. It’s essential to remember that the yield curve is not a tool, not a commandment, but an indicator, and indicators can give false positives and incorrect indications.
How to Interpret the Yield Curve for Investment Decisions
Now that you know what a yield curve is, its predictive power, and its limitations, how can you use this information in your investment journey?
If you are a long-term investor, a normal yield curve is the best news, as it suggests a stable economic environment, which is suitable for the growth of both the debt and equity markets.
On the other hand, if the curve starts to flatten or invert, it may be time to consider defensive strategies, such as increasing your allocation to bonds, especially longer-duration ones, or rotating into sectors like utilities and consumer staples, which tend to perform better during downturns.
For short-term investors, the curve offers valuable insights into allocation. If short-term yields are high, putting money in short-duration CDs or treasury bills might yield better returns than locking it in long-term.
In short, the yield curve slope can help you adjust your sails, whether you’re investing for growth, income, or preservation.
Conclusion: Reading the Curve to Stay Ahead
The direction of the yield curve slope gives you a sneak peek into the future economic health of a country. A normal yield curve indicates a healthy, robust economy, whereas an inverted yield curve can indicate tougher economic times in the coming months. As an investor, you can combine the yield curve reading with other economic indicators such as inflation rate, GDP growth, employment rate, etc., to anticipate the financial state of the country in the coming months to tailor your investment strategy.
Discover fixed income investments with Jiraaf, a SEBI registered online bonds platform that educates and brings access to a wide array of bonds. Sign up today to explore diversified fixed income investment opportunities to support your goal-based wealth creation journey. Start investing!